|
|
Workbench
-
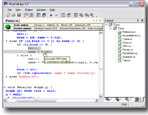
The user interface is based on the appearance of Microsoft's Visual Studio .NET
-
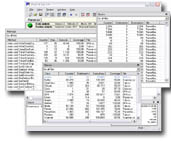
The workbench includes sorted lists of counters at a level of:
-
basic blocks,
-
methods/properties/constructors... and
-
classes/structs
-
Clicking on an entry of one of these lists highlights the corresponding block
in the source code
-
If the user clicks on a statement in the source code, the corresponding block
is highlighted and the execution frequency is shown in a little popup window
right at the cursor position
-
Counters are stored to a file and can be reloaded afterwards if the sources
haven't changed to continue profiling at another time.
-
Reset counters either for a single files or for the whole project
-
Color blocks with a specific execution frequency, for example:
-
Blocks that have never been executed: red font
- Blocks with a counter from
40-80: blue font, bold, yellow background
- Blocks with a counter greater than
1000: green font, italic
You can activate and deactivate this feature with only one mouse click and
define as many color ranges as you want.
Statistical information
-
For each basic block:
-
Execution frequency (counter)
-
Number of statements included
-
The number of executed statements (executions)
-
Additionally, for each method, constructor, property,... as well as for each
class and struct:
-
Code coverage, which means (executed statements / statements)
Project handling
-
Add/remove one or more files to a project
-
Include external libraries
-
Define start arguments
-
Run console applications as well as windows applications
-
Select those files that should be profiled
-
Create solutions and projects as well as in Visual Studio.NET
-
Import your solutions created in Visual Studio.NET with only one click!
|

|
|
New release, Sourceforge page and new team
|
|

|
|
New Prof-It Versions
|
|
0 KB
|
|
|
Find more downloads and detailled descriptions here.
|
|