|
|
Screenshots
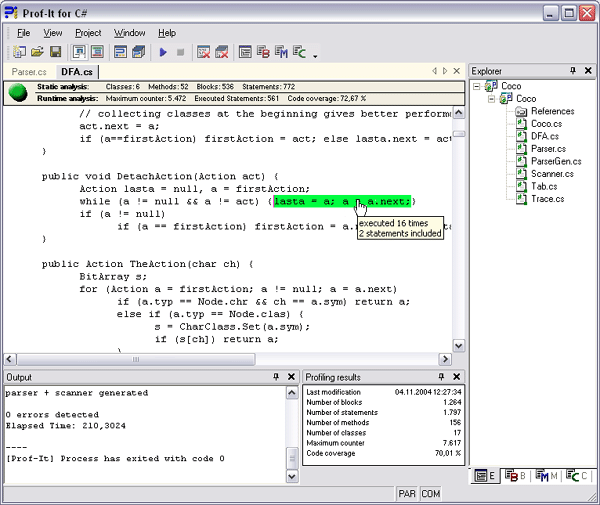
Clicking on a basic block in the source code optionally highlights the whole block and a tooltip shows
runtime information about the block. An own tab at the bottom displays a summary of the last profiling results.
The current project can be handled in the project tree on the right side, as you can do it in
Visual Studio.NET

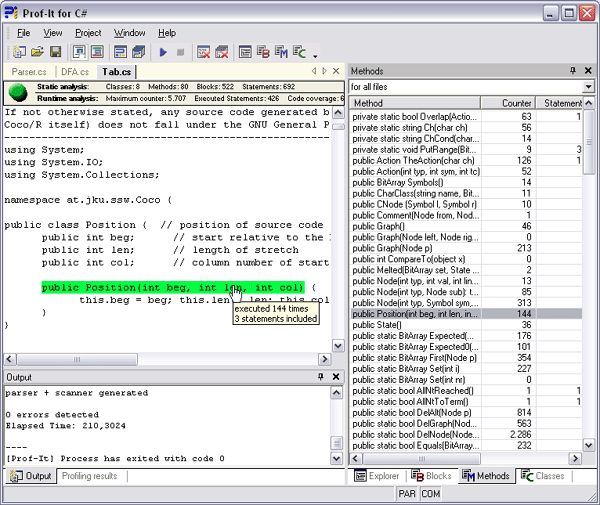
You have to the possiblity to view the counters at a level of basic blocks, methods or classes. In the next example, you can
see all methods (and also constructors, properties and events) on the right side with their corresponding counters,
number of statements included and you can also see the code coverage for each method or class.

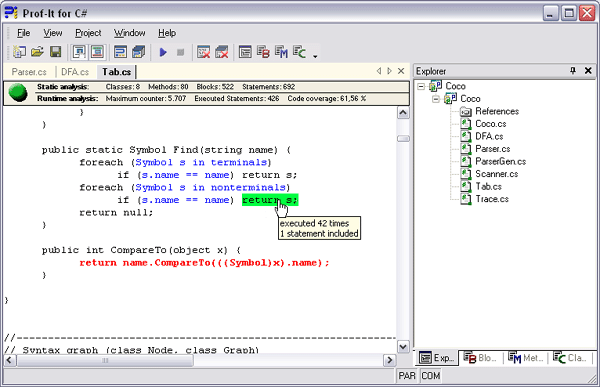
Basic blocks with a certain execution frequency can be colored. In the following example, all
basic blocks, that have never been executed have been colored red, and all blocks with a
counter greater than 1000 are colored blue.

|

|
|
New release, Sourceforge page and new team
|
|

|
|
New Prof-It Versions
|
|
0 KB
|
|
|
Find more downloads and detailled descriptions here.
|
|